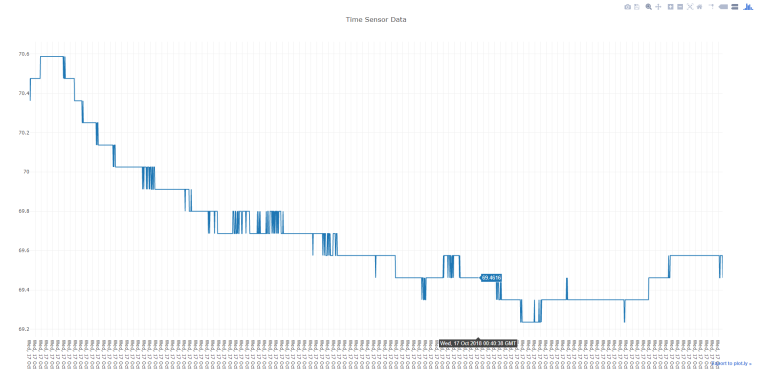
@Lazar-Demin I checked this morning and it seemed to be working. I was looking for the sensor chart.
Best posts made by Frank Wiebenga
-
RE: Available Apps Spinningposted in Omega Talk
-
Beginner Sensor Data Chartposted in Projects
Hello guys, I'm new here and wanted to share a simple little start to hopefully a bigger project. This is a great start to getting used to Python and MongoDB.
Whoever wrote the starter documentation, THANK YOU! I used that here.
Requirements: Install python3-light, pip3, flask, flask-restful on the Omega. Install plotly and pymongo on the client.
The code that runs on the Omega is under
Appdirectory. This is a ultra simple flask api that reads the temperature. You can configure this to run on boot by addingpython3 /App/App.pyto/etc/rc.local.You will need another computer running MongoDB. Using the other computer you can request the temp and store the data using the
App.pyscript found inClientfolder. Using theGraph.pyscript will generate a cool little graph.

Probably don't need 1 second intervals, but this was a really fun and cool way to get started with python. Google truly was my friend and I hope some else looking to use a DS18B20 sensor finds this useful.